A Baseline IB Strategy
2/22/20262 min read
I regularly get asked about the specifics of my strategy and entry criteria, and my answer is always the same: I don’t share the details of my strategy because it wouldn’t actually help the trader asking. I use custom tools that I don’t share, and my approach isn’t binary—there’s a level of discretion involved that comes from experience.
I put together the following strategy simply to demonstrate how a few straightforward requirements built around a statistical edge—such as the IB data on NQ Stats—can be used to form a strategy. This is not my personal strategy, and I do not trade it. It was created and optimized specifically for the purpose of this post and has only been tested on the in-sample data referenced below.
It should be viewed purely as an example, not as a fully developed or live-ready strategy.
Parameters & Conditions
This back test covers Jan 1, 2025 to Feb 20, 2026.
1 MNQ per trade, max 1 trade per day.
The trade is only taken after the IB range has closed.
The trade is forced closed at 1pm ET if PT is not hit.
The IB Range must be 175 points or less.
IB must not be broken yet at the time the trade is taken.
For Longs
IB closes in upper half of IB range.
IB low was set first, IB high was set last.
Post IB close, goes long at a 35% pullback down (65% level of IB range).
PT is IB high, SL is IB low.
For Shorts
IB closes in lower half of IB range.
IB high was set first, IB low was set last.
Post IB close, goes short at 35% pullback up (35% level of IB range).
PT is IB low, SL is IB high.
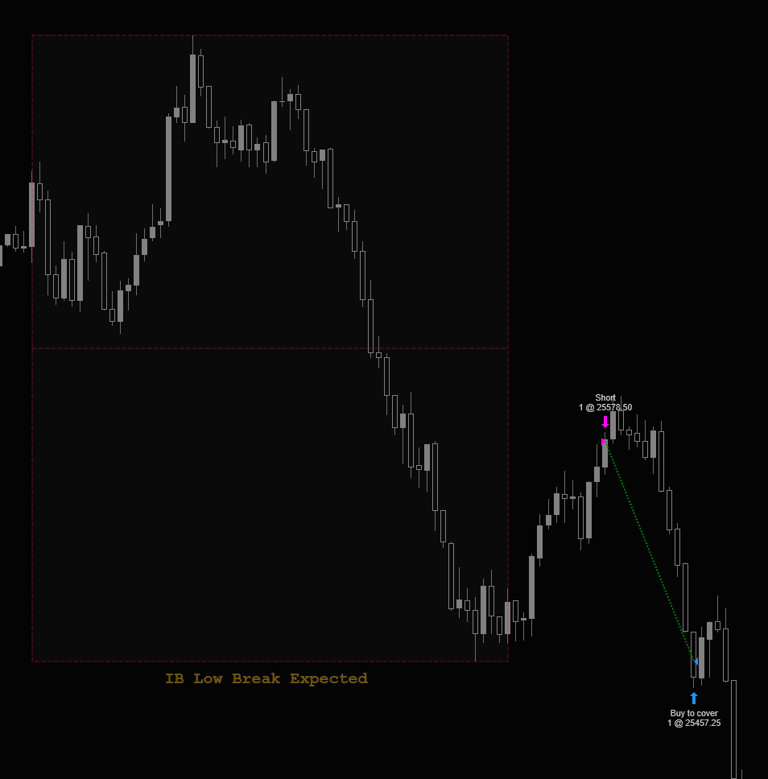
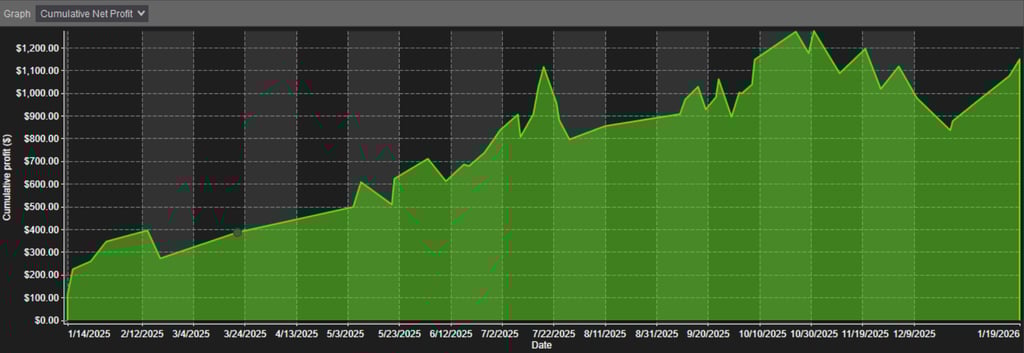
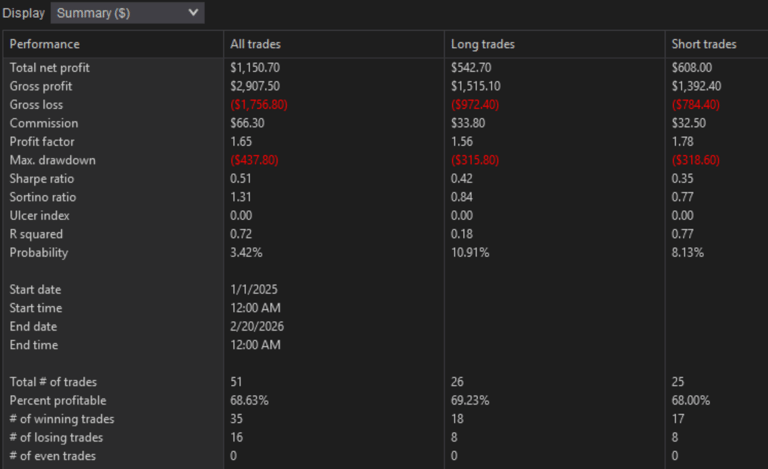
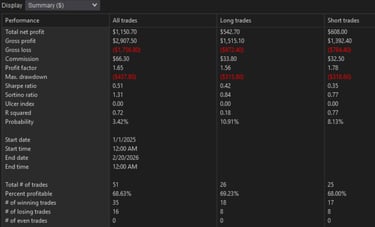
Below you will find an example trade with these parameters, as well as a performance report and equity curve. As mentioned before, this is for demonstration purposes only and to showcase how a stat can have a strategy built around it. It should be viewed purely as an example, not as a fully developed or live-ready strategy. The results below are curve fit and this strategy will likely show poor performance outside of the date range it was optimized in.